Fourier series
Add sines and cosines to approximate a periodic function, and change the number of terms N to watch convergence and the Gibbs phenomenon.
From geometry and algebra to analysis and statistics, use interactive visualizations to see the core picture of each topic.
23 topics
Add sines and cosines to approximate a periodic function, and change the number of terms N to watch convergence and the Gibbs phenomenon.
Start from the phase relation and compare displacement superposition, stationary-wave nodes, and two-source interference fringes, then watch how nearby frequencies form an envelope of beats.
One eccentricity carries a conic from a near-circle ellipse through a parabola to one hyperbola branch.
One 2×2 matrix carries the plane by its two column vectors, and the same matrix is read again as signed area and as the order of composition.
One scale shrinks both the area slices and the local step, and the definite integral and the derivative both come out of a finite approximation.
How one slope field decides the solution curves, how they split by initial value, and the error of step-by-step integration.
One rotation, read as complex multiplication, a point on the unit circle, and the cosine and sine of the same angle.
One rule for the next term can make a partial sum converge or diverge, or send an orbit into a dense cloud of points.
The same combination count returns as a binomial coefficient, a lattice-path count, and a recurrence cell, while a Catalan number keeps only the paths that stay legal.
All three modes ask the same thing: what the sample space is right now, and why intuition goes wrong.
One exponential, read three ways: a mirror across y = x, a straight line on a log axis, and why e is natural.
Read one plane vector as a position, a direction, or coordinates, and use the same picture for a projection, a dot product, a basis, and a normal.
One angle is first a point on the unit circle, then sides of a triangle, then the sum of two angles.
One function graph can be reshaped by a transformation, and its place relative to the x-axis reads off solutions of equations and inequalities.
Read a rational graph from cancellation, zeros, and asymptotes, and move the factor parameters.
Read a radian as arc length on the unit circle, unfold it into y = sin x, then set amplitude A, period T, and phase φ.
Switch among a point cloud, one point's influence, and a sorted sample, and compare how the mean, an outlier, and the quartiles change the reading.
One bar chart can be read as a center, a spread, and a tail, and the probability mass shifts when the counting question changes.
Fix one vector and one plane, and answer in order where it is, which way the plane faces, and how the two are related.
Lay constraints, the objective direction, and the vertex candidates over one feasible region, and use three views to confirm where a linear optimum appears.
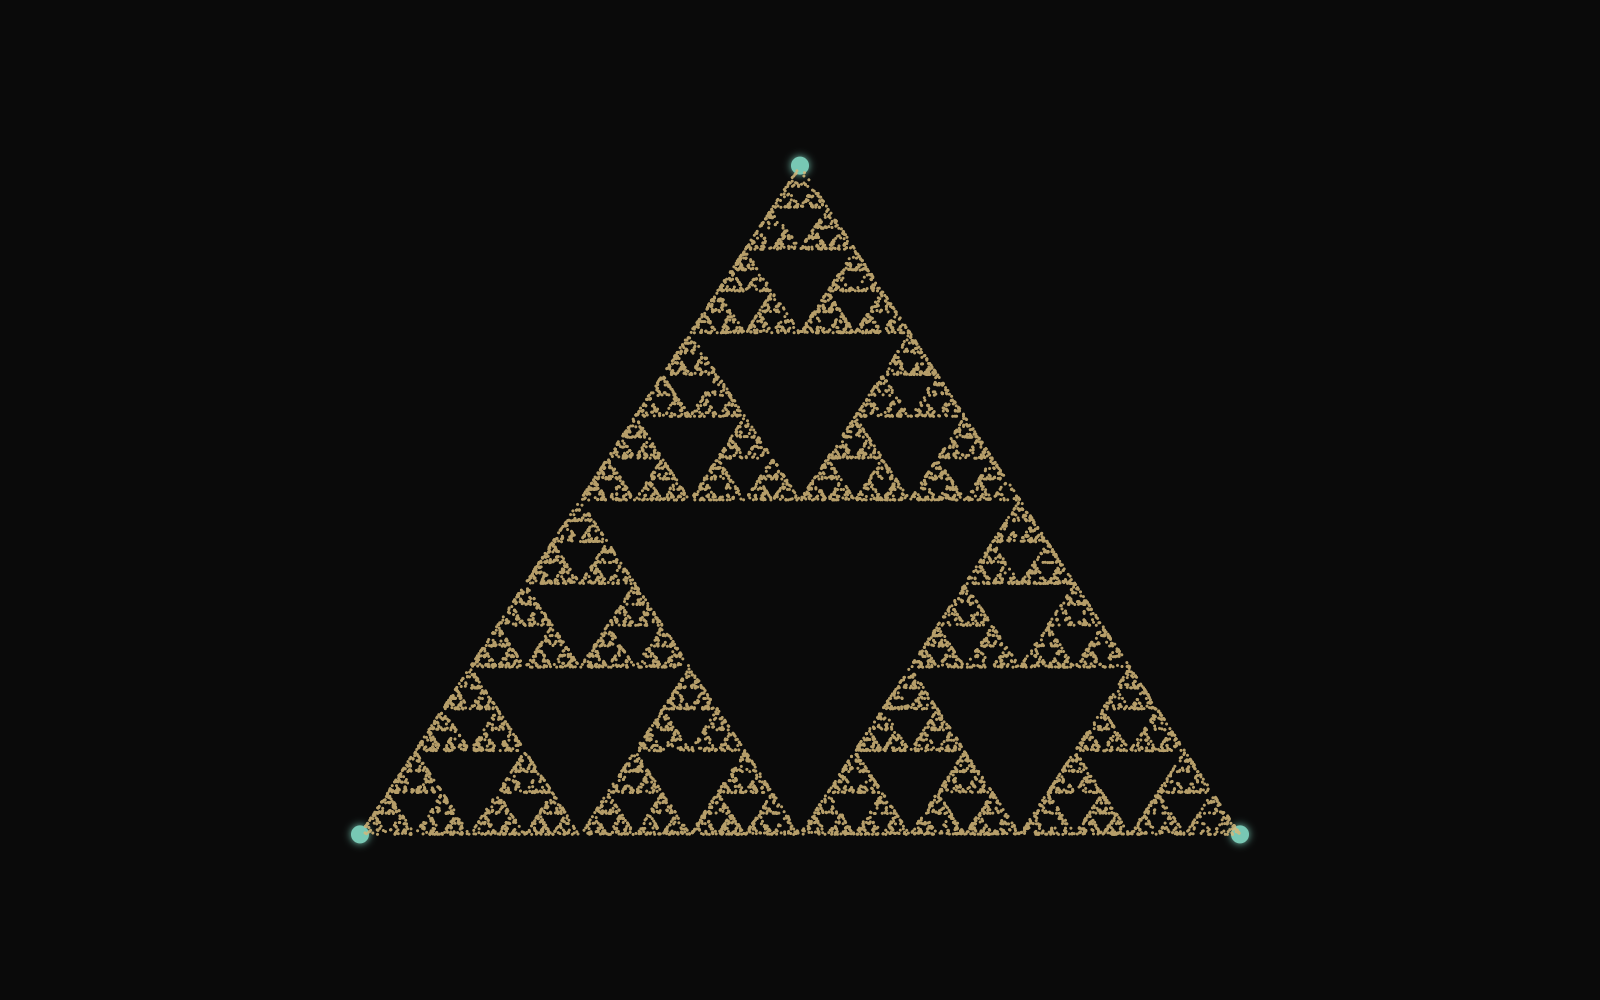
Apply one rule again and again, and compare fixed points, short periods, dense long-run values, and self-repeating fractals.
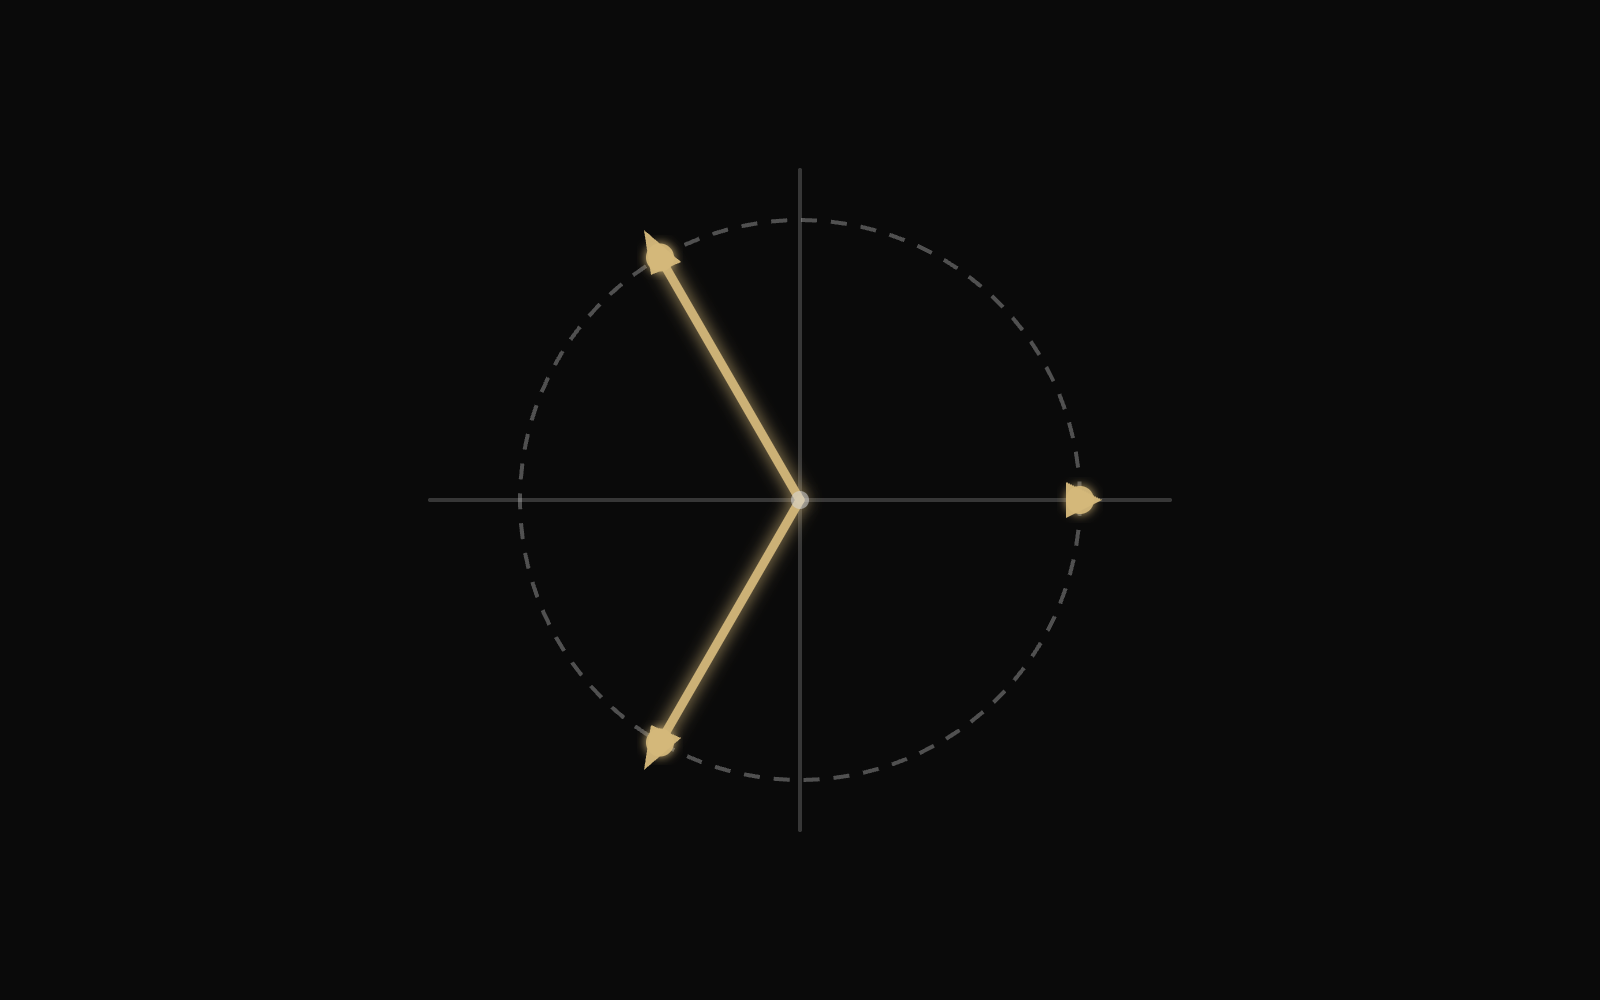
The same addition of arguments shows up in a product, in an nth power, and in n equal roots.
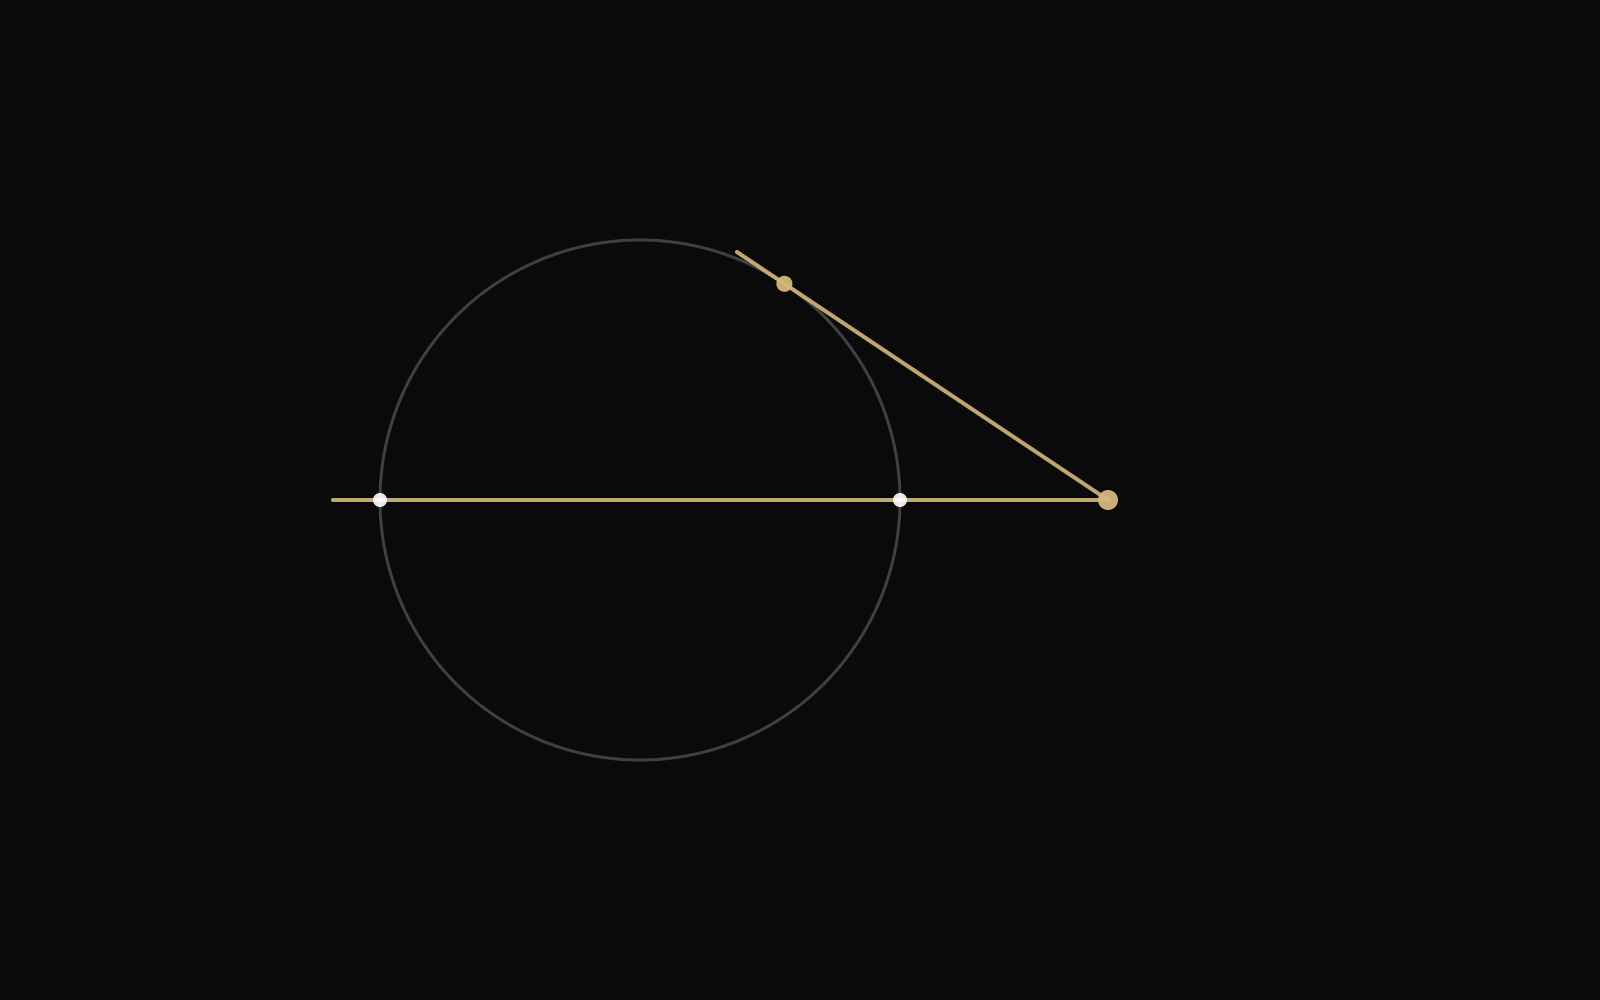
At one exterior point, the secant product and the square of the tangent segment are the same number.
Nothing matches this category yet