Data analysis
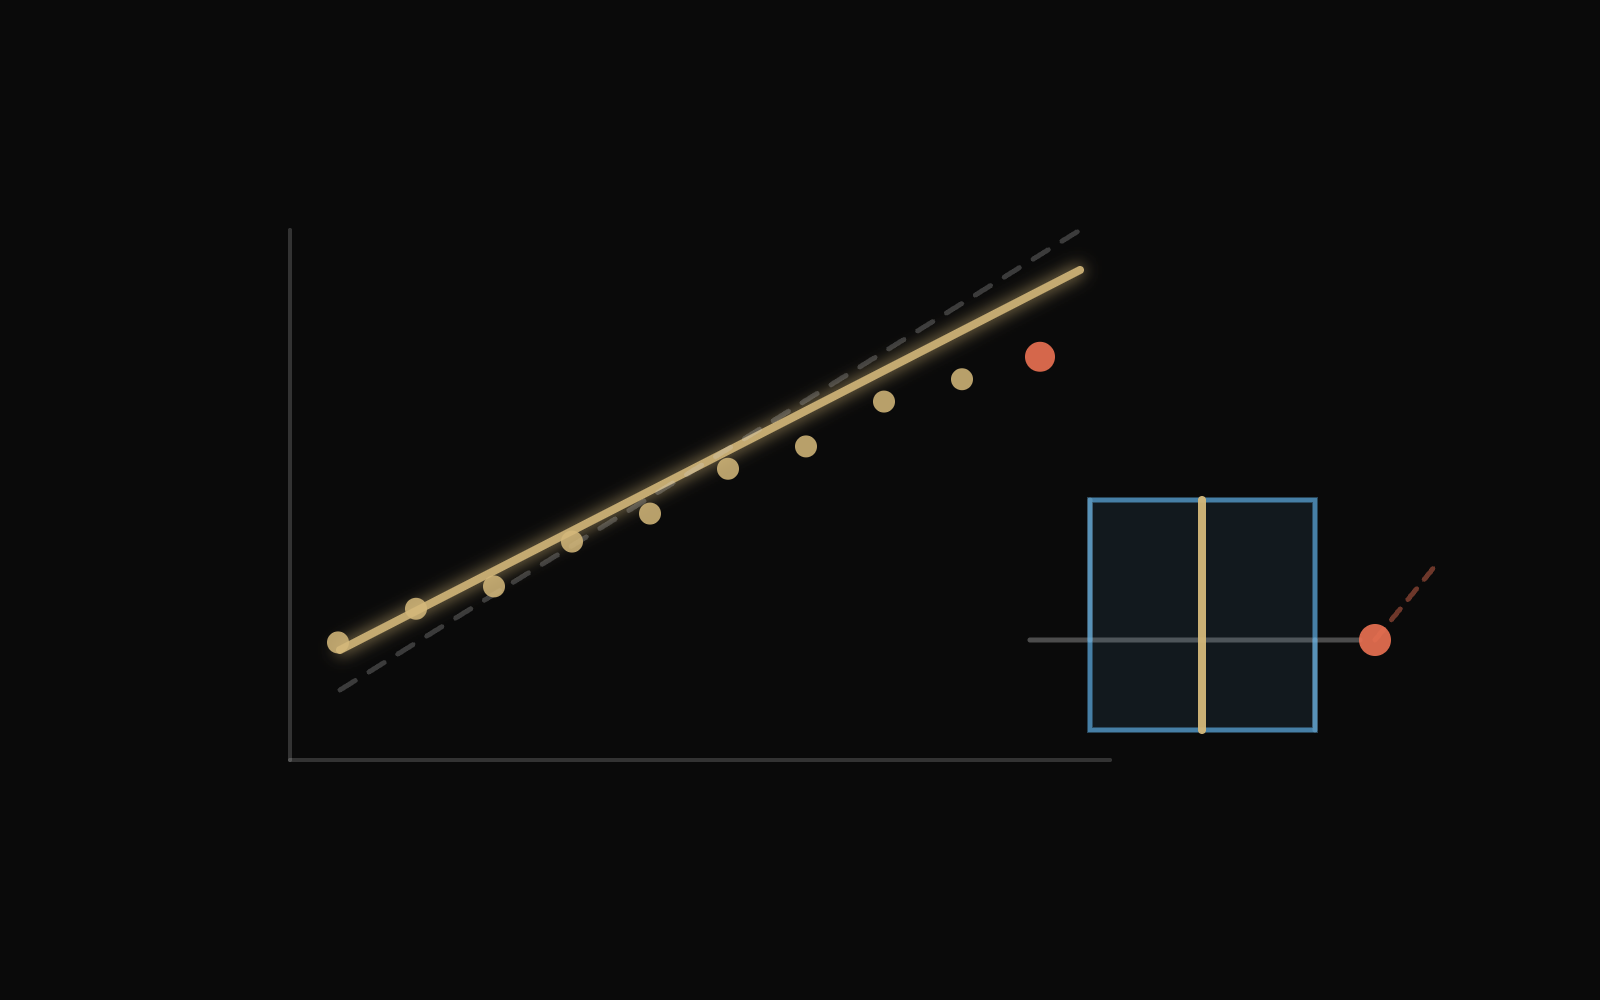
Switch among a point cloud, one point's influence, and a sorted sample, and compare how the mean, an outlier, and the quartiles change the reading.
3 pieces about this concept, across works, topic guides, and exam visualizations.
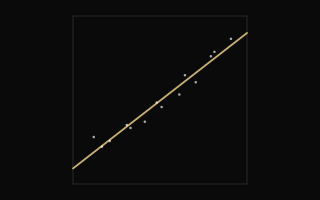
Drag points in a two-dimensional cloud and watch the direction, the correlation r, and the least-squares line change together.
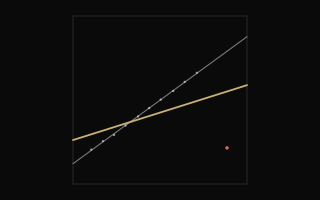
Keep the main cloud fixed and move one highlighted point to see how its horizontal distance and residual pull the least-squares line.