Discrete random variables and distributions
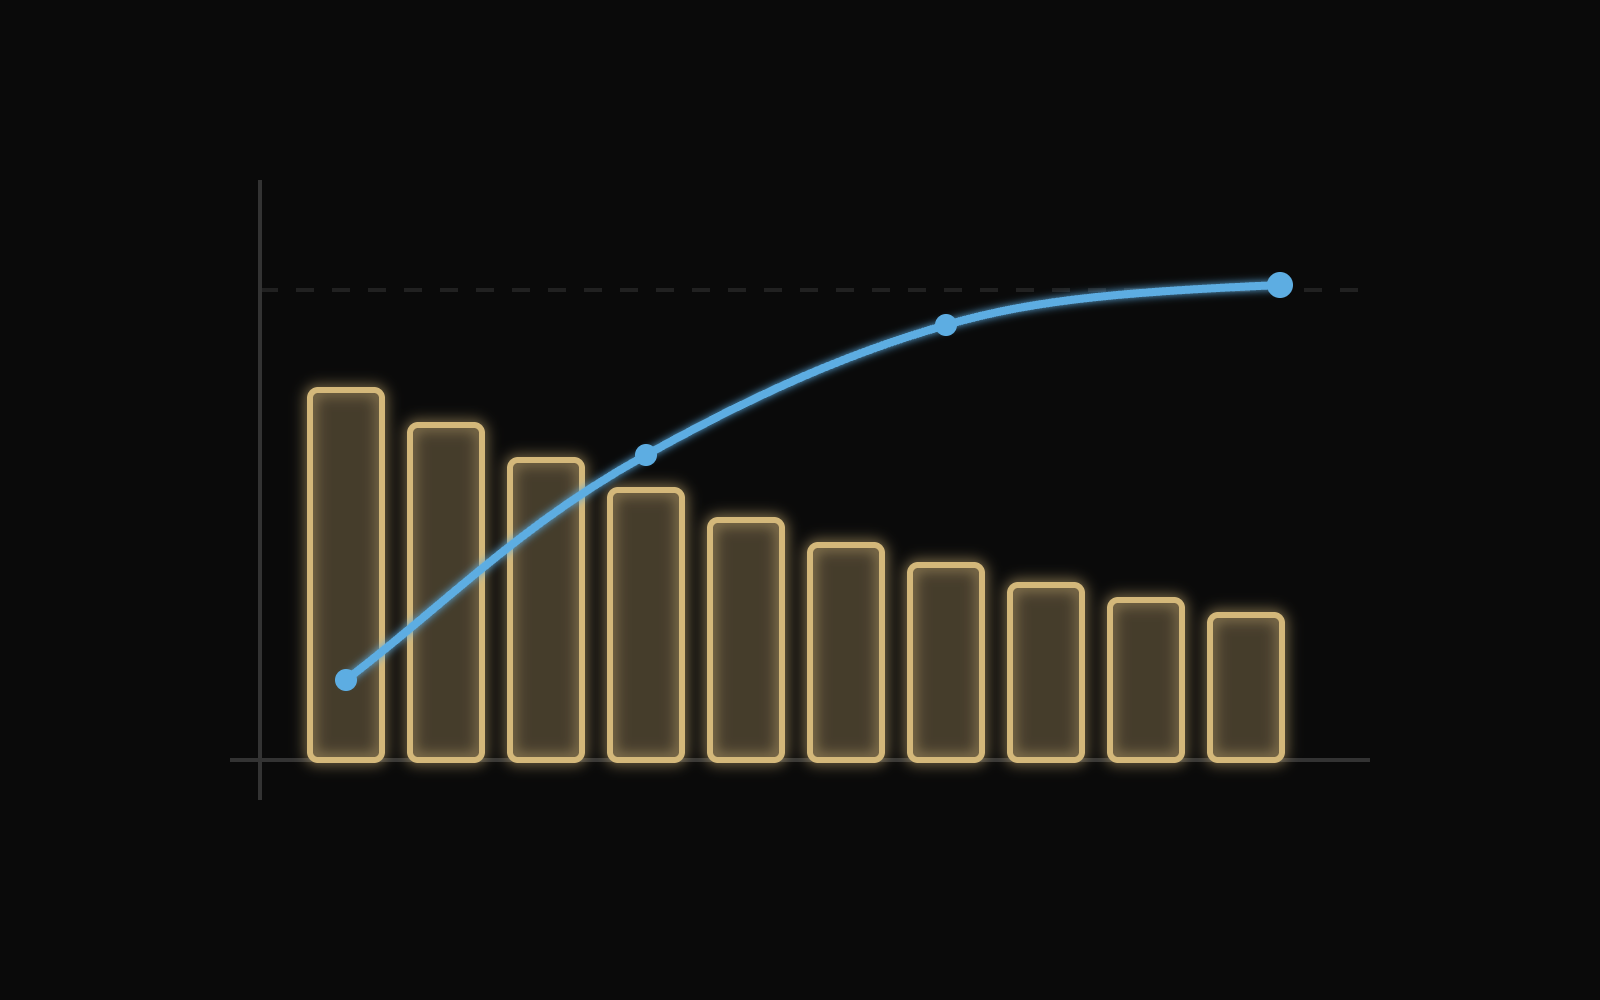
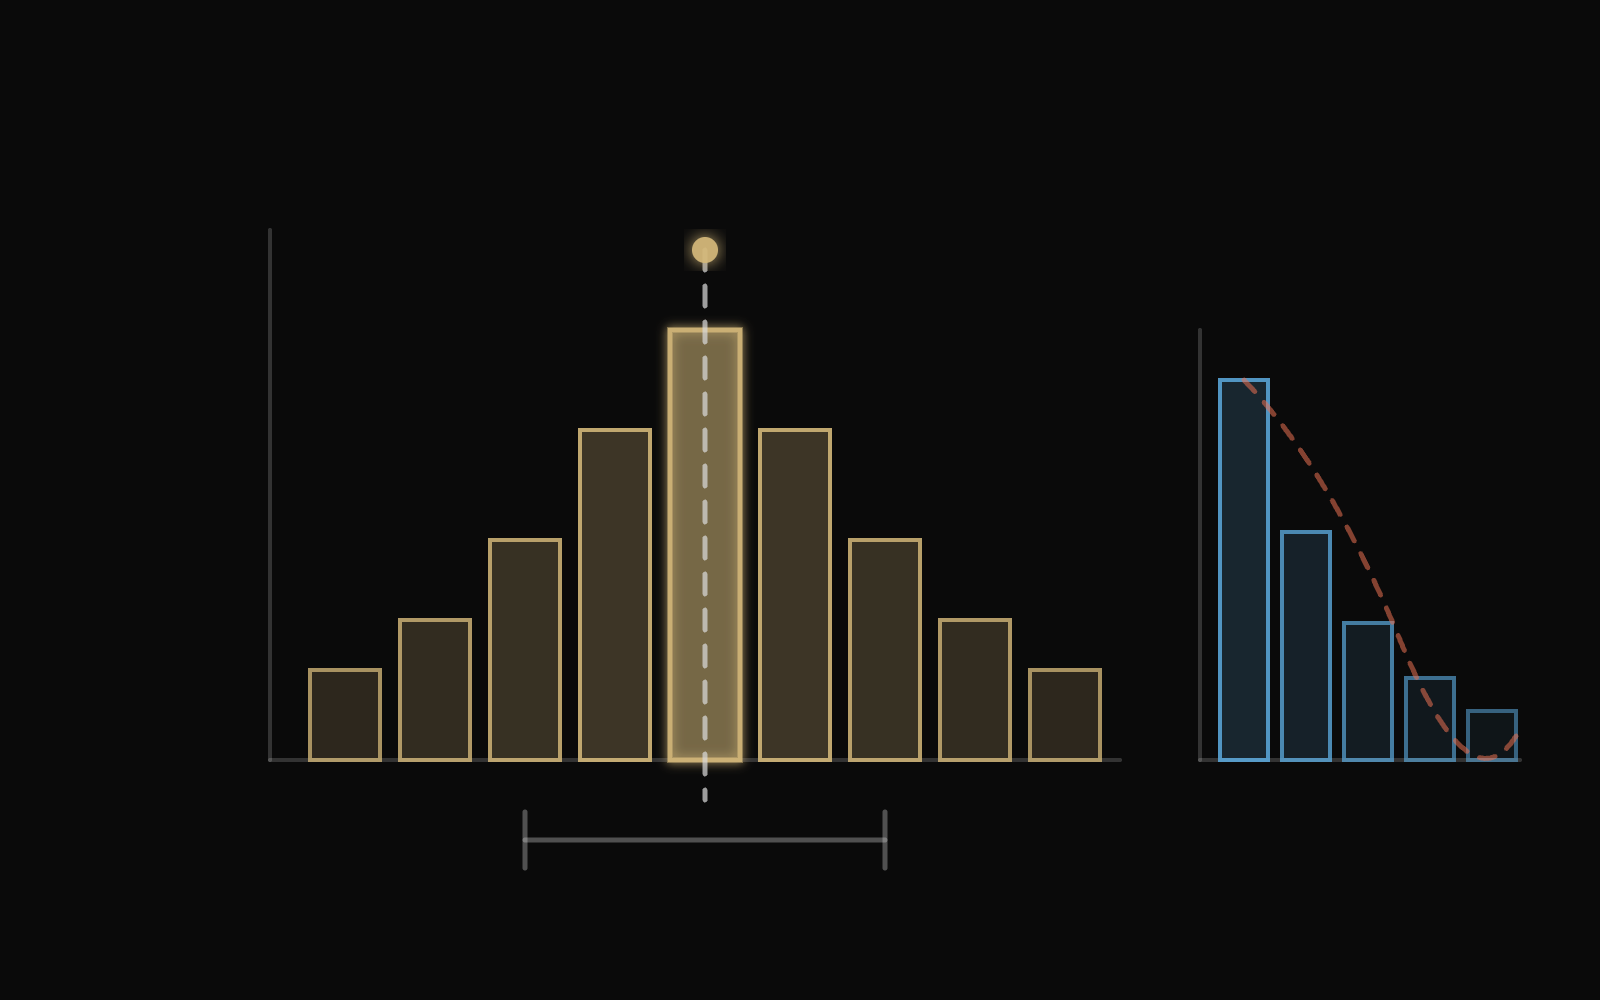
One bar chart can be read as a center, a spread, and a tail, and the probability mass shifts when the counting question changes.
2 pieces about this concept, across works, topic guides, and exam visualizations.