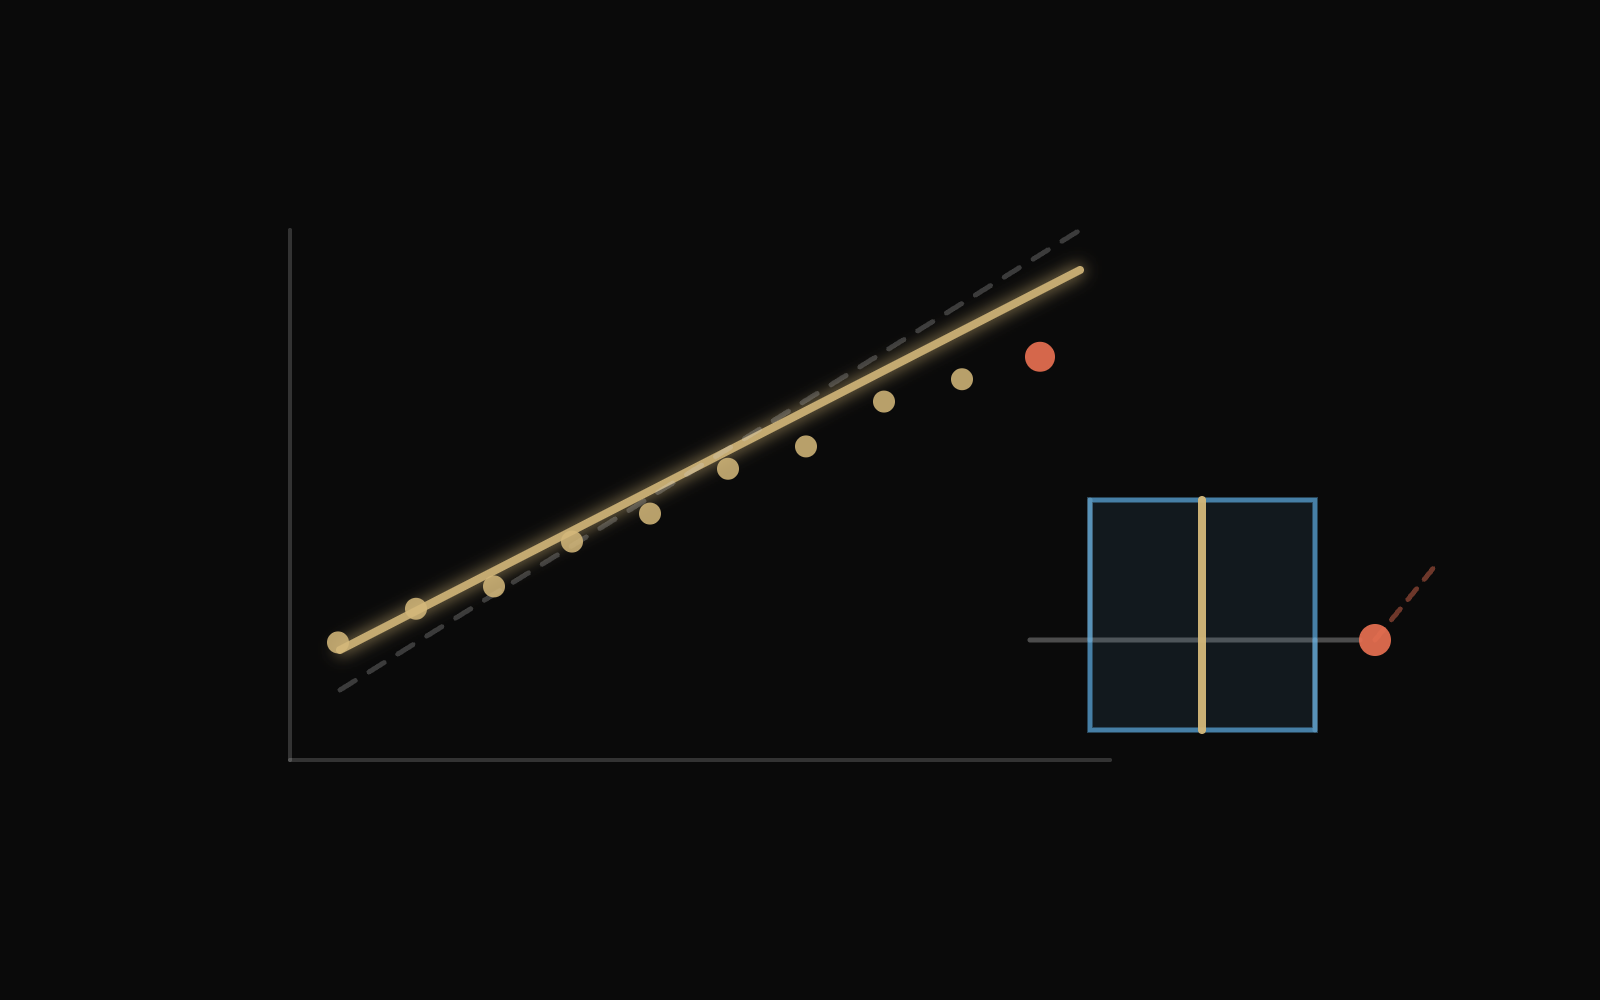
Interactive Data analysis Statistics Intuitive exploration Switch among a point cloud, one point's influence, and a sorted sample, and compare how the mean, an outlier, and the quartiles change the reading.
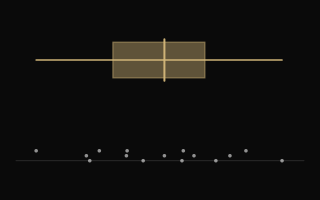
Work Percentiles and a box plot Probability and statistics High-school concept Sort one-dimensional values and drag them to watch the median, the interquartile range, and the tail outliers update.